
An important component of mobile app development is the creation of informative graphs and charts. Visual representation of data is crucial for conveying complex information to users simply and concisely.
SwiftUI is a framework presented at WWDC19. It allows you to design and develop user interfaces with less code in a declarative way. Unlike the existing, familiar UIKit, which was usually used in combination with storyboards or XIBs, SwiftUI is completely based on program code. However, the syntax of the latter is much easier to understand, which speeds up the implementation of set tasks.
Although SwiftUI provides a powerful set of tools for creating screens and user interfaces, until iOS 16, there was no native framework from Apple for working with graphs. Of course, this didn't mean that there was no way to create apps with graphs and charts. There were two ways to create graphs natively (using struct Shapes) or use third-party frameworks.
Here are some ways to implement charts in iOS 16:
Features and challenges of working with charts in iOS
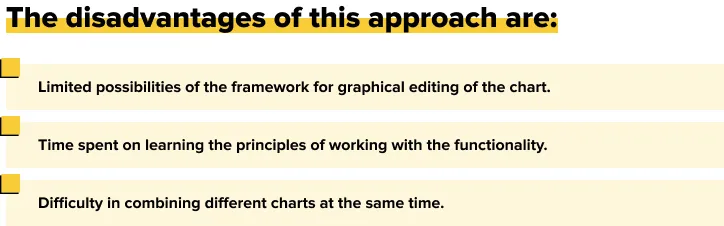
- Developing graphics natively using struct Shapes, or rather struct Path, allows you to create your shapes and objects with any geometric properties, customize the animation of your graphic objects, and divide your UI into many small components, which makes it easier to manage and maintain the code. But this option has the following disadvantages:
- Using third-party frameworks saves development time and provides a relatively secure and proven code base (since the code has been used many times in other projects).
However, even here there are drawbacks:dependence on a third-party framework and its subsequent update after critical bugs are found or with the release of new versions of iOS;
dependence of some frameworks on others and their mutual compatibility;
a significant increase in the size of the program.
Today we’re going to show you how we at Lampa Software have successfully tested different ways of creating charts for our customers' applications. For example, let's take the format of a regular line chart.
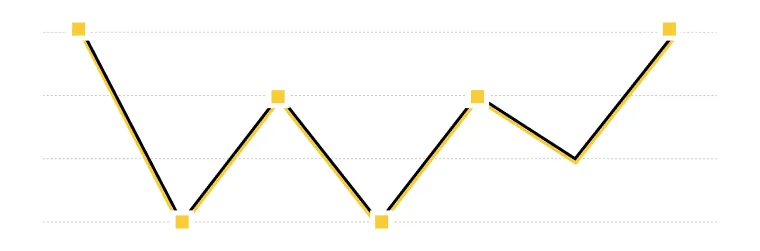
The image below shows a broken-line graph with round points of current values, where the days of the week are marked horizontally, and the mood options (Excellent, Good, Usual, Terrible) are marked vertically by day.
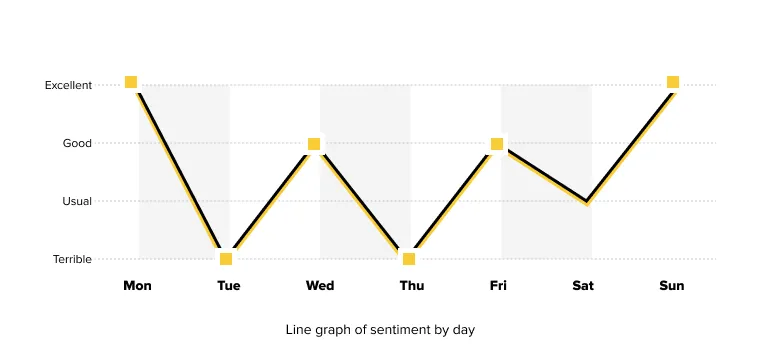
Line graph of sentiment by day
We needed to develop a line graph using the SwiftUI framework, with support starting from iOS 15. In addition, it was necessary to minimize the use of third-party frameworks. Given that the specialized framework Swift Charts is available only with iOS 16, our team started with a native way via struct Path.
Method №1: Shapes
SwiftUI provides many powerful tools out of the box, with Shapes being one of them, and Apple's tools include Capsule, Circle, Ellipse, Rectangle, and RoundedRectangle. The Shape protocol conforms to the Animatable and View protocols, which means we can customize their appearance and behavior. But we can also create our shape using the Path structure (the outline of a two-dimensional shape we draw ourselves). The Shape protocol contains an important method func path(in: CGRect) -> Path: after implementing it, we must return a Path describing the structure of the newly created Shape.
Let's start by creating a LineView struct that accepts an array of optional values of type Double? and uses Path to draw a graph from each previous array value to the next.
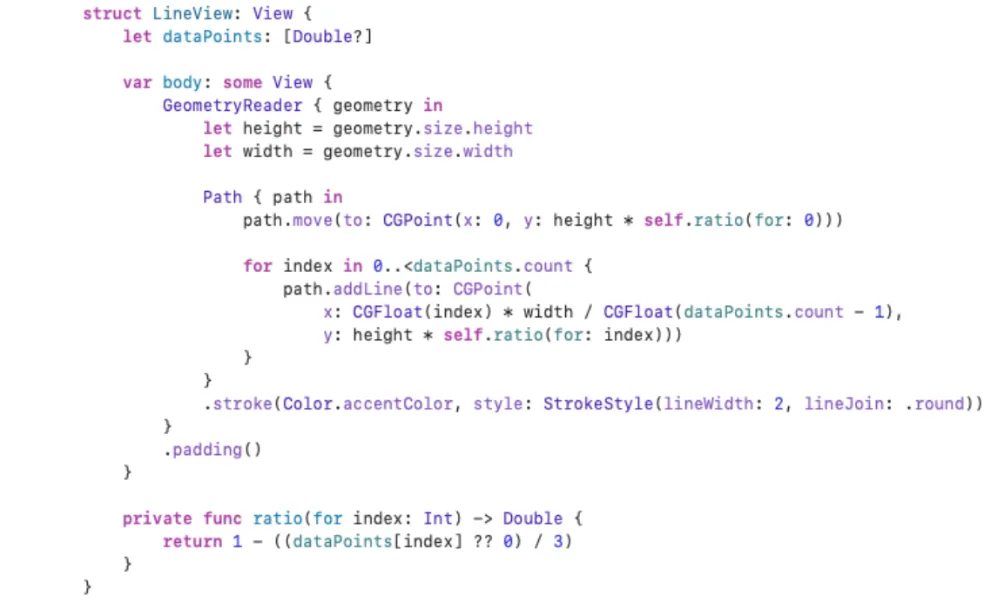
To determine the boundary dimensions of the graph and calculate ratios, we use the GeometryReader, which will allow us to get the height and width values for superview. These values, along with the func ratio(for index: Int) -> Double method, calculate the location of each point on the line by multiplying the height by the ratio of the individual data point to the highest point (func ratio(for index: Int)).
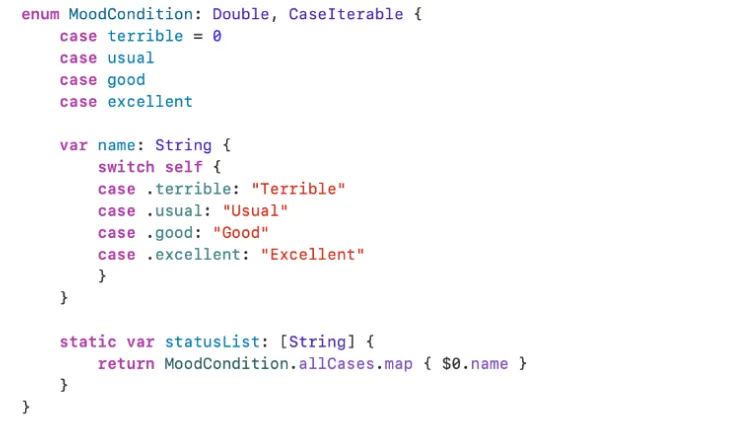
To emulate the input data, we will create an enum MoodCondition that will describe different possible states:
Using the enum MoodCondition, let's define the variable let selectedWeek, which will store the MoodCondition states for all days of the week:
let selectedWeek: [Double?] = [
MoodCondition.great.rawValue,
MoodCondition.soso.rawValue,
MoodCondition.fine.rawValue,
MoodCondition.soso.rawValue,
MoodCondition.fine.rawValue,
MoodCondition.normal.rawValue,
MoodCondition.great.rawValue ]
Similar to the struct LineView, we will create a separate struct LineChartCircleView. The specified structure also accepts an array of optional values (let dataPoints), and an additional value let radius. The structure draws separate round points with a radius of radius also through Path.
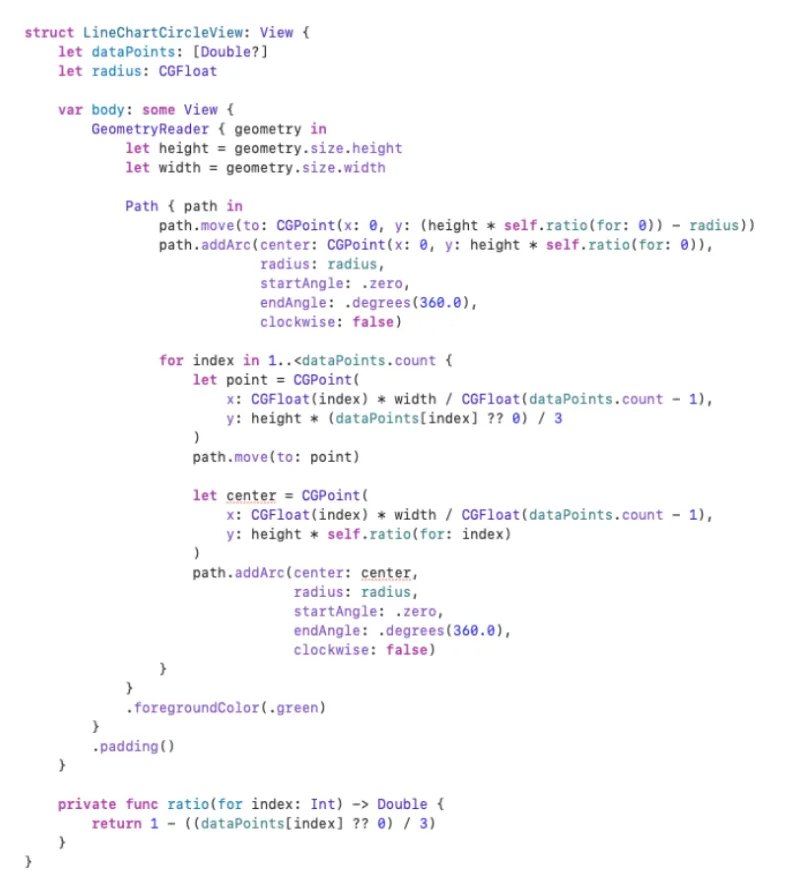
We overlay struct LineChartCircleView on struct LineView and get a broken-line graph with points for each value:
Combining LineChartCircleView and LineView
It is important to display the X and Y coordinate axes along with the curves, so let's start with the implementation of the Y axis, namely, by creating a struct YAxisView:
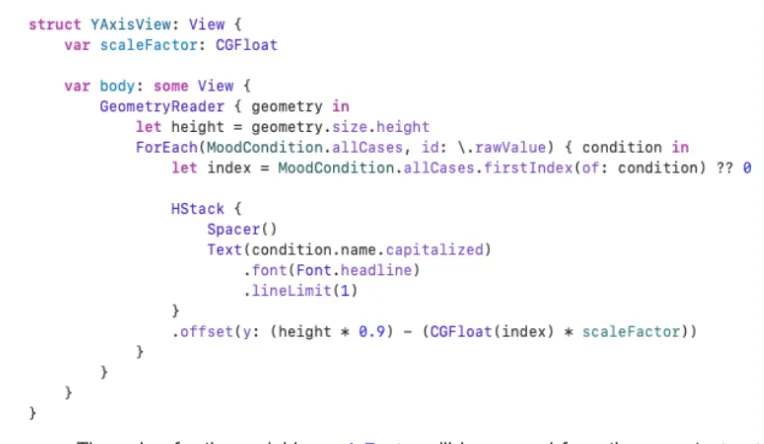
The value for the variable scaleFactor will be passed from the parent struct LineChartView, and the offset modifier will list all possible MoodCondition depending on the value of each value and the height of the chart.
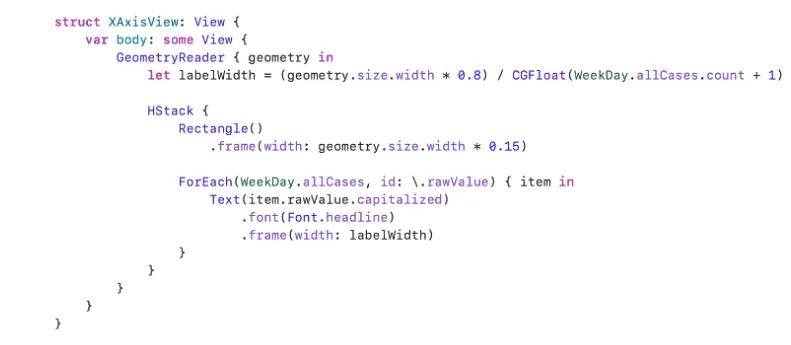
To construct the coordinate X, create a struct XAxisView:
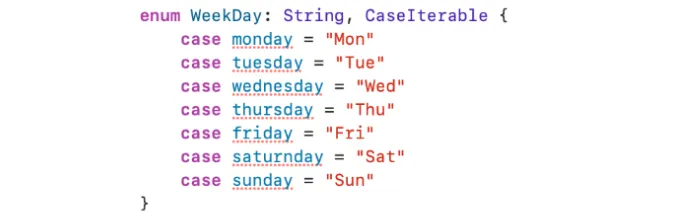
Create an enum WeekDay to display all days of the week on the XaxisView axis:
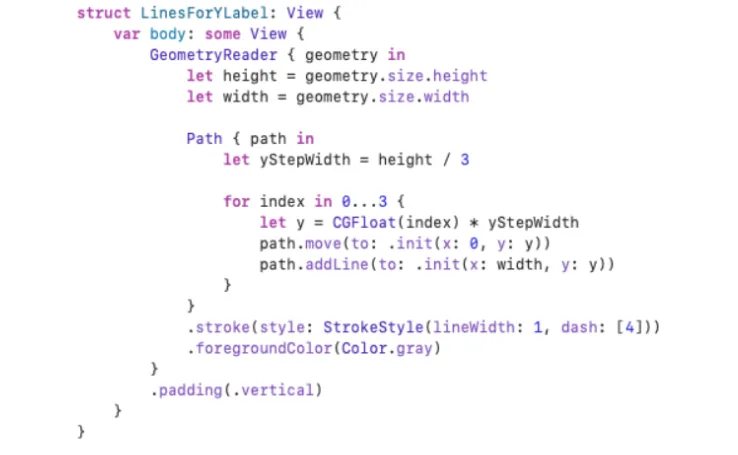
To make the graph easier to use, let's add horizontal dashed grid lines for the Y-axis, which will correspond to each MoodCondition. To do this, create a separate struct LinesForYLabel:
It is important to combine all the Views into one single struct LineChartView, where they will be contained simultaneously:
X and Y axes;
broken-line graph;
intersection points;
horizontal dashed lines for the Y-axis.
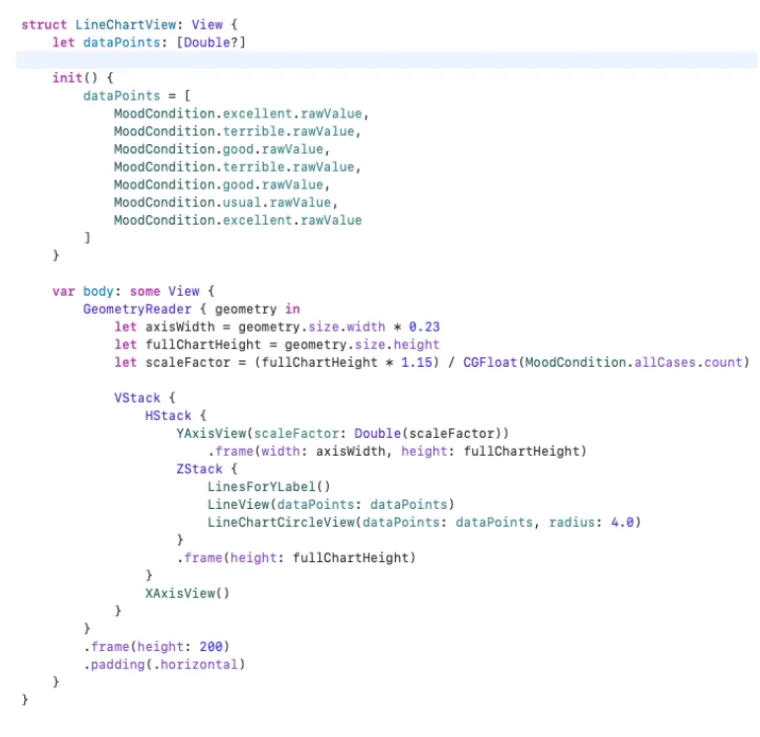
Using init(), we initialize the struct LineChartView with the input data for the dataPoints property through MoodCondition for all days of the week. The calculation of axisWidth and scaleFactor values is based on the ratio of values along the Y-axis and the size of the chart and may vary depending on the design. The structures LinesForYLabel(), LineView(dataPoints: dataPoints), LineChartCircleView(dataPoints: dataPoints, radius: 4.0) are superimposed on each other and placed in the ZStack. Then they are combined with YAxisView(scaleFactor: Double(scaleFactor)) and XAxisView() in HStack/VStack, respectively.
This way, you can develop any variants and combinations of charts. However, there is an interdependence of each component of the View, for example, the amount of code and the complexity of maintaining and expanding the existing functionality.
Method №2: SwiftUICharts
Another option for building a similar chart is to use a third-party framework, such as SwiftUICharts.
It's what they do:
Pie charts, line charts, bar charts, and histograms.
Various coordinate grids.
Interactive labels to show the current value of the chart, etc.
The library is available with iOS 13 and Xcode 11 and can be installed via Swift Package Manager or CocoaPods. After adding SwiftUICharts to your project, you need to import the framework using import SwiftUICharts:
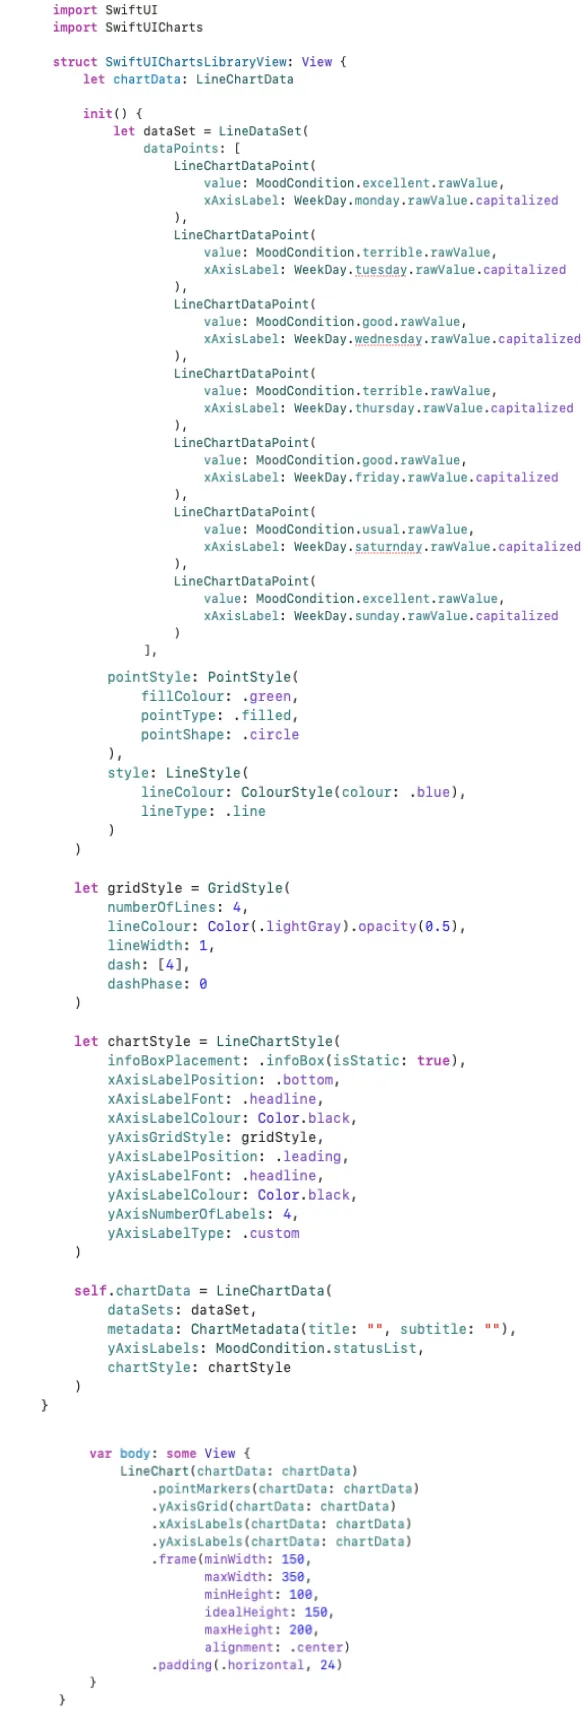
First, we initialize the let dataSet model with input data based on values from enum MoodCondition and enum WeekDay. Immediately, we configure the point markers with pointStyle and the model to control the style of the lines with style. We use GridStyle to configure the grid view for the chart and LineChartStyle to add the main chart settings.
The configuration returns a LineChartData object with all the necessary settings. This allows you to specify the required array of input values and customize the chart display according to the specified design.
Method №3: Swift Charts
The last option for building a chart is the Swift Charts framework.
It creates various types of charts, including line, dot, and bar charts. Scales and axes that correspond to the input data are automatically generated for them.
We import the framework using import Charts, then create a struct Day function that will correspond to a specific day WeekDay and MoodCondition:

Based on the struct Day, we will create a let currentWeeks variable that will correspond to the given week with the corresponding Day:
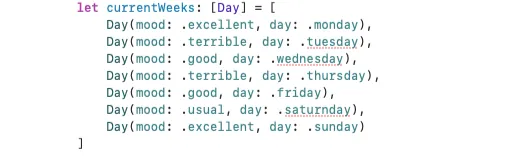
To build the required graph, we use structures:
LineMark, which visualizes data using a sequence of connected segments.
PointMark, which displays data using dots.
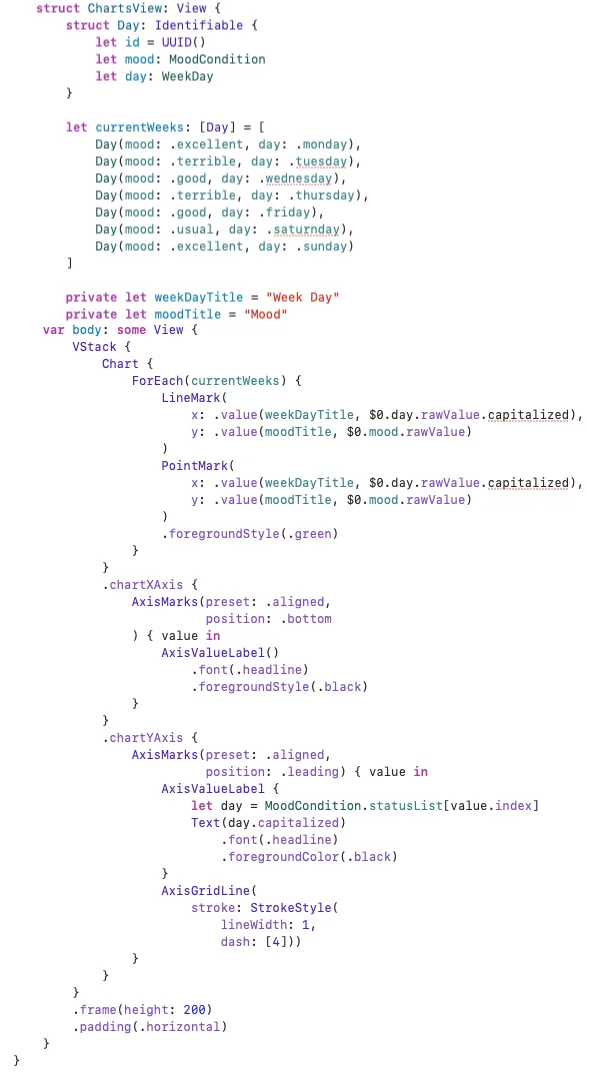
Using ForEach, we run through all the input data currentWeeks and set x, y values to LineMark and PointMark, respectively.
In the .chartXAxis modifier, set up the axis:
Positioning.
Color.
Scale for the X-axis.
The same applies to chartYAxis, but we also configure the Y-axis grid.
The peculiarity of using Swift Charts is that, with the help of various modifiers, we can quickly create many different types of charts without much effort. The framework is easy to use, supports animation, has a wide range of functions for creating and editing charts/diagrams, and also contains a lot of material on how to work with it.
Let's compare the options for building charts using Shapes, SwiftUIChartsLIbrary, and Swift Charts for a comparative analysis:
The result was as follows:
Create diagrams using Shapes, SwiftUIChartsLibrary, Swift Charts
So, we have tested 3 different options for building diagrams in the SwiftUI environment. Let's compare them.
Criterion | Shapes | SwiftUIChartsLibrary | Swift Charts |
Approach to construction | Manual creation of a chart | Using the library | Using the framework |
Time | Takes a long time | Less time (when customizing the chart) | Less time (declarative approach) |
Reliability | Reliable, native | Library dependency | Framework dependency, native |
Support for different versions of iOS | iOS 13 and above | iOS 13 and above | iOS 16 and above |
Ease of use (intuitiveness) | Not difficult, but requires some experience | Relatively easy to use | Intuitive and easy to use |
Scope of work (program code) | Big | Little | Little |
Customization options | Great customization options | Extensive graphics editing functionality, but limited by the library | Intuitive customization, but limited by the framework |
Availability of optimization in the future | Yes | Yes, subject to third-party support | Yes |
The number of possible diagrams to implement | There are practically no restrictions | Wide functionality, but limited by the library | Wide functionality, but limited by the framework |
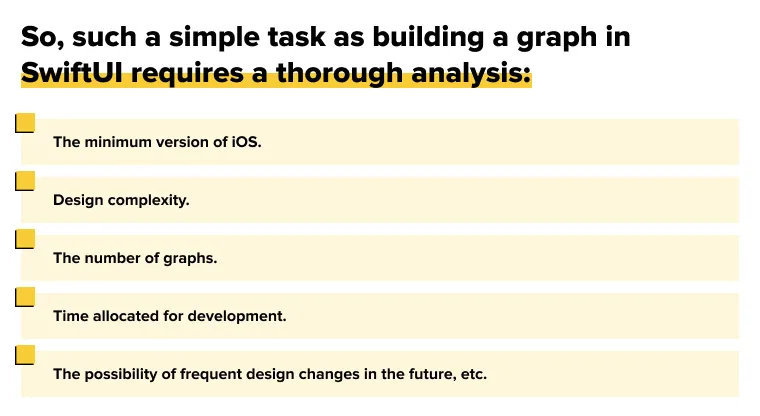
We have created a primitive chart, but even such a simple design allows you to understand all the difficulties that may arise in the future for iOS developers when building charts using the SwiftUI framework.