
THD: Cloud Software Solution by Lampa.dev
THD is a cloud software solution that uses state-of-the-art connected vehicle and machine learning technologies to prioritize the flow of vehicles in a city and across a corridor.
Government Service
Industry
Web Development
Service
July 2021 - September 2022
Project Duration
Problems
While analyzing the first feedback, we held several brainstorming sessions and identified the key problems of the operational staff.
Operator dependency
Dependence of the system on personnel and inability to work in automatic mode
Long term failure detection
It is not always possible for a person to detect a mistake without a lot of analytical work
Generating reports manually
Generating reports manually is time-consuming. Especially if you need to prepare several reports for a certain time period
Dashboard UI representation
Different departments require different interfaces with the possibility of customization
User Insights
We conducted several rounds of user interviews with various teams involved in operations to better understand the context of user experience.
Interview:
Transportation Engineer Team
Place of work:
Santa Clara Valley Transportation Authority
Responsibilities:
Control over the operation of intersection control systems and urban transport services
Problems
Long-term failure detection
Shortage of staff
Operator dependence
Generating reports manually
How a product can meet customer needs?
David
Senior Transportation Engineer
”THD can help automate my workday. I`ll be able to monitor the activity of vehicles, data communication channels remotely and independently, without the help of local operators. I`ll be able to track the movement of all buses on the route, and an alert system will let him know if there is a failure somewhere.”
Interview:
Communications manager Team
Place of work:
Sacramento metropolitan fire district
Responsibilities:
Managing all communication devices, apparatus and all radios including station alerting equipment, preemption equipment on the vehicle, the lights and sirens, and any equipment on apparatus for intersection preemption.
Problems
Generating reports manually
Equipment malfunctions
Incorrect determination of the fastest routes to hot spots
Visibility of vehicles on the map
Unsafe route
Short distance preemption of traffic lights
How a product can meet customer needs?
Steve
Communications manager
”THD will monitor the anticipation of traffic lights on the route of the fire engine to hot spots, show the distance to the point, make the route safe and as fast as possible. THD will increase the distance to anticipate traffic lights at an intersection along the path of a fire engine. Thanks to the system, Steve will be able to generate reports on the work of the department quickly, saving time.”
User Stories
These user stories highlight key features that THD users need for seamless navigation, data visualization, and access to real-time and historical metrics. The requirements ensure user-friendly navigation, efficient data sharing, and comprehensive performance monitoring.
- As a THD user, I want to have a menu and set of tabs to navigate seamlessly through the sections and tools of the site

- As a THD user, I want to have an interactive web interface that can be navigated using industry best practices such as fixed menus, search bars, links, breadcrumbs, tabs, shortcuts, or others, in order to have a complete set of navigation around the system.

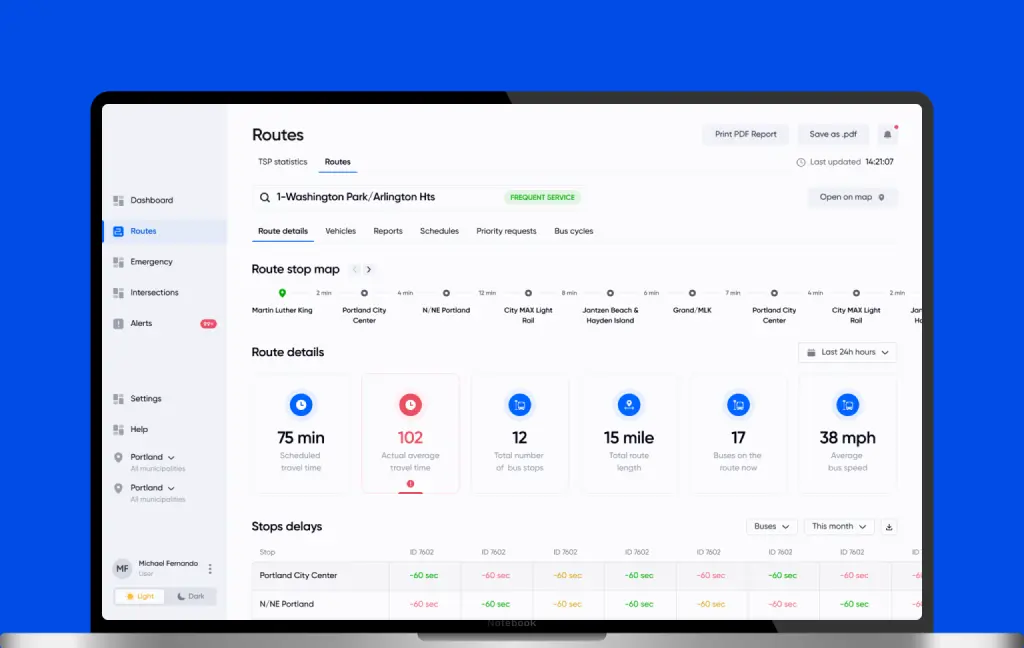
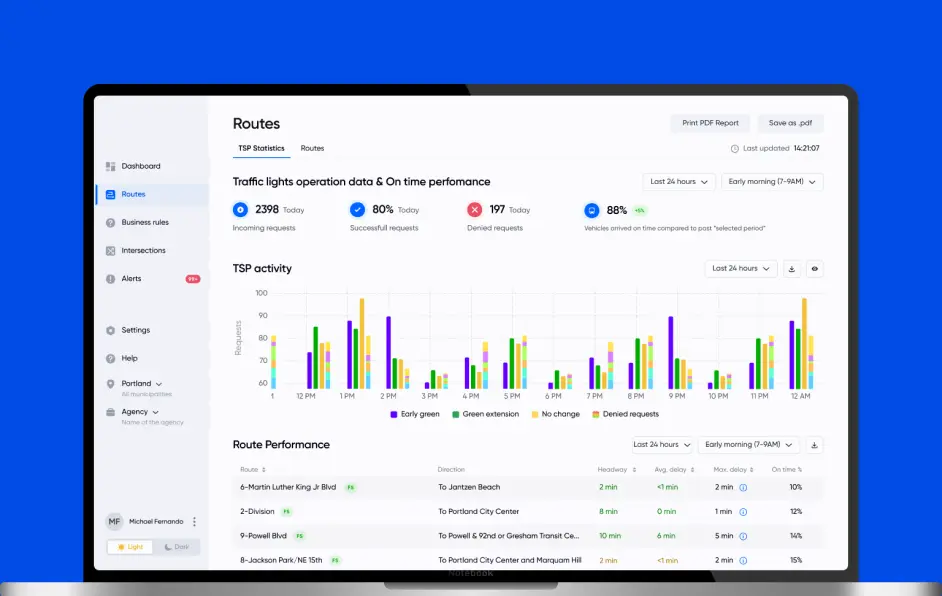
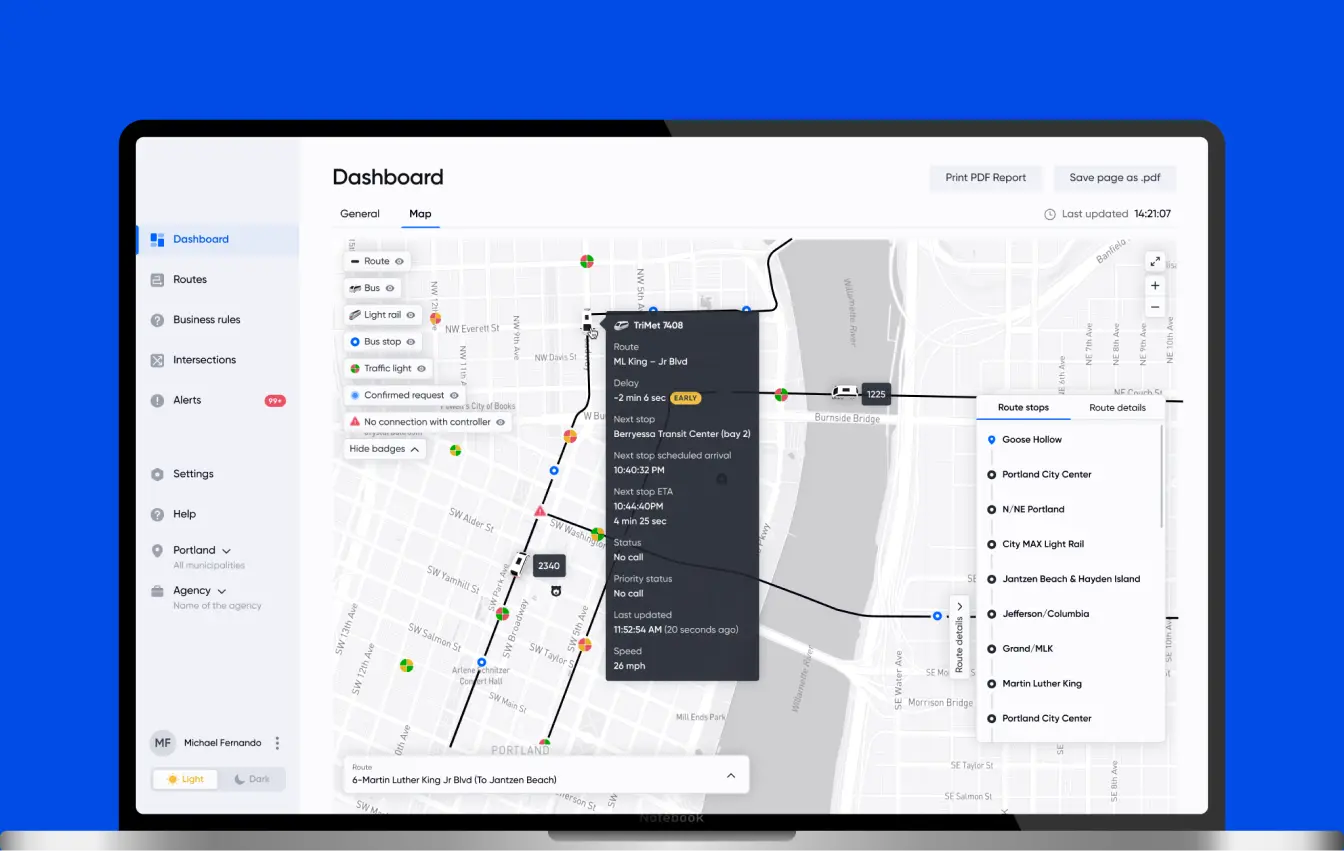
- As a THD user, I want to see various methods of graphing data on the dashboard, including geographic maps, data charts and tables, in order to have a full range of different information
- As a THD user I want to print any page in the user interface to share the paper variant of data with others
- As a THD user, I want the dashboard scorecard to auto-refresh every 5 minutes or less to see the latest overall performance metrics
- As a THD user, I want to be able to customize the timing of the map display so that I have data on road congestion, priority traffic requests and signaling strategies in the past to be able to see historical playback data (basing on the feature list)

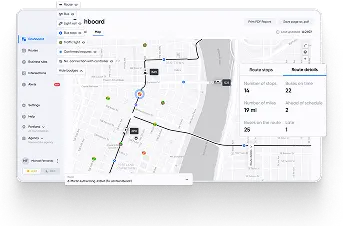
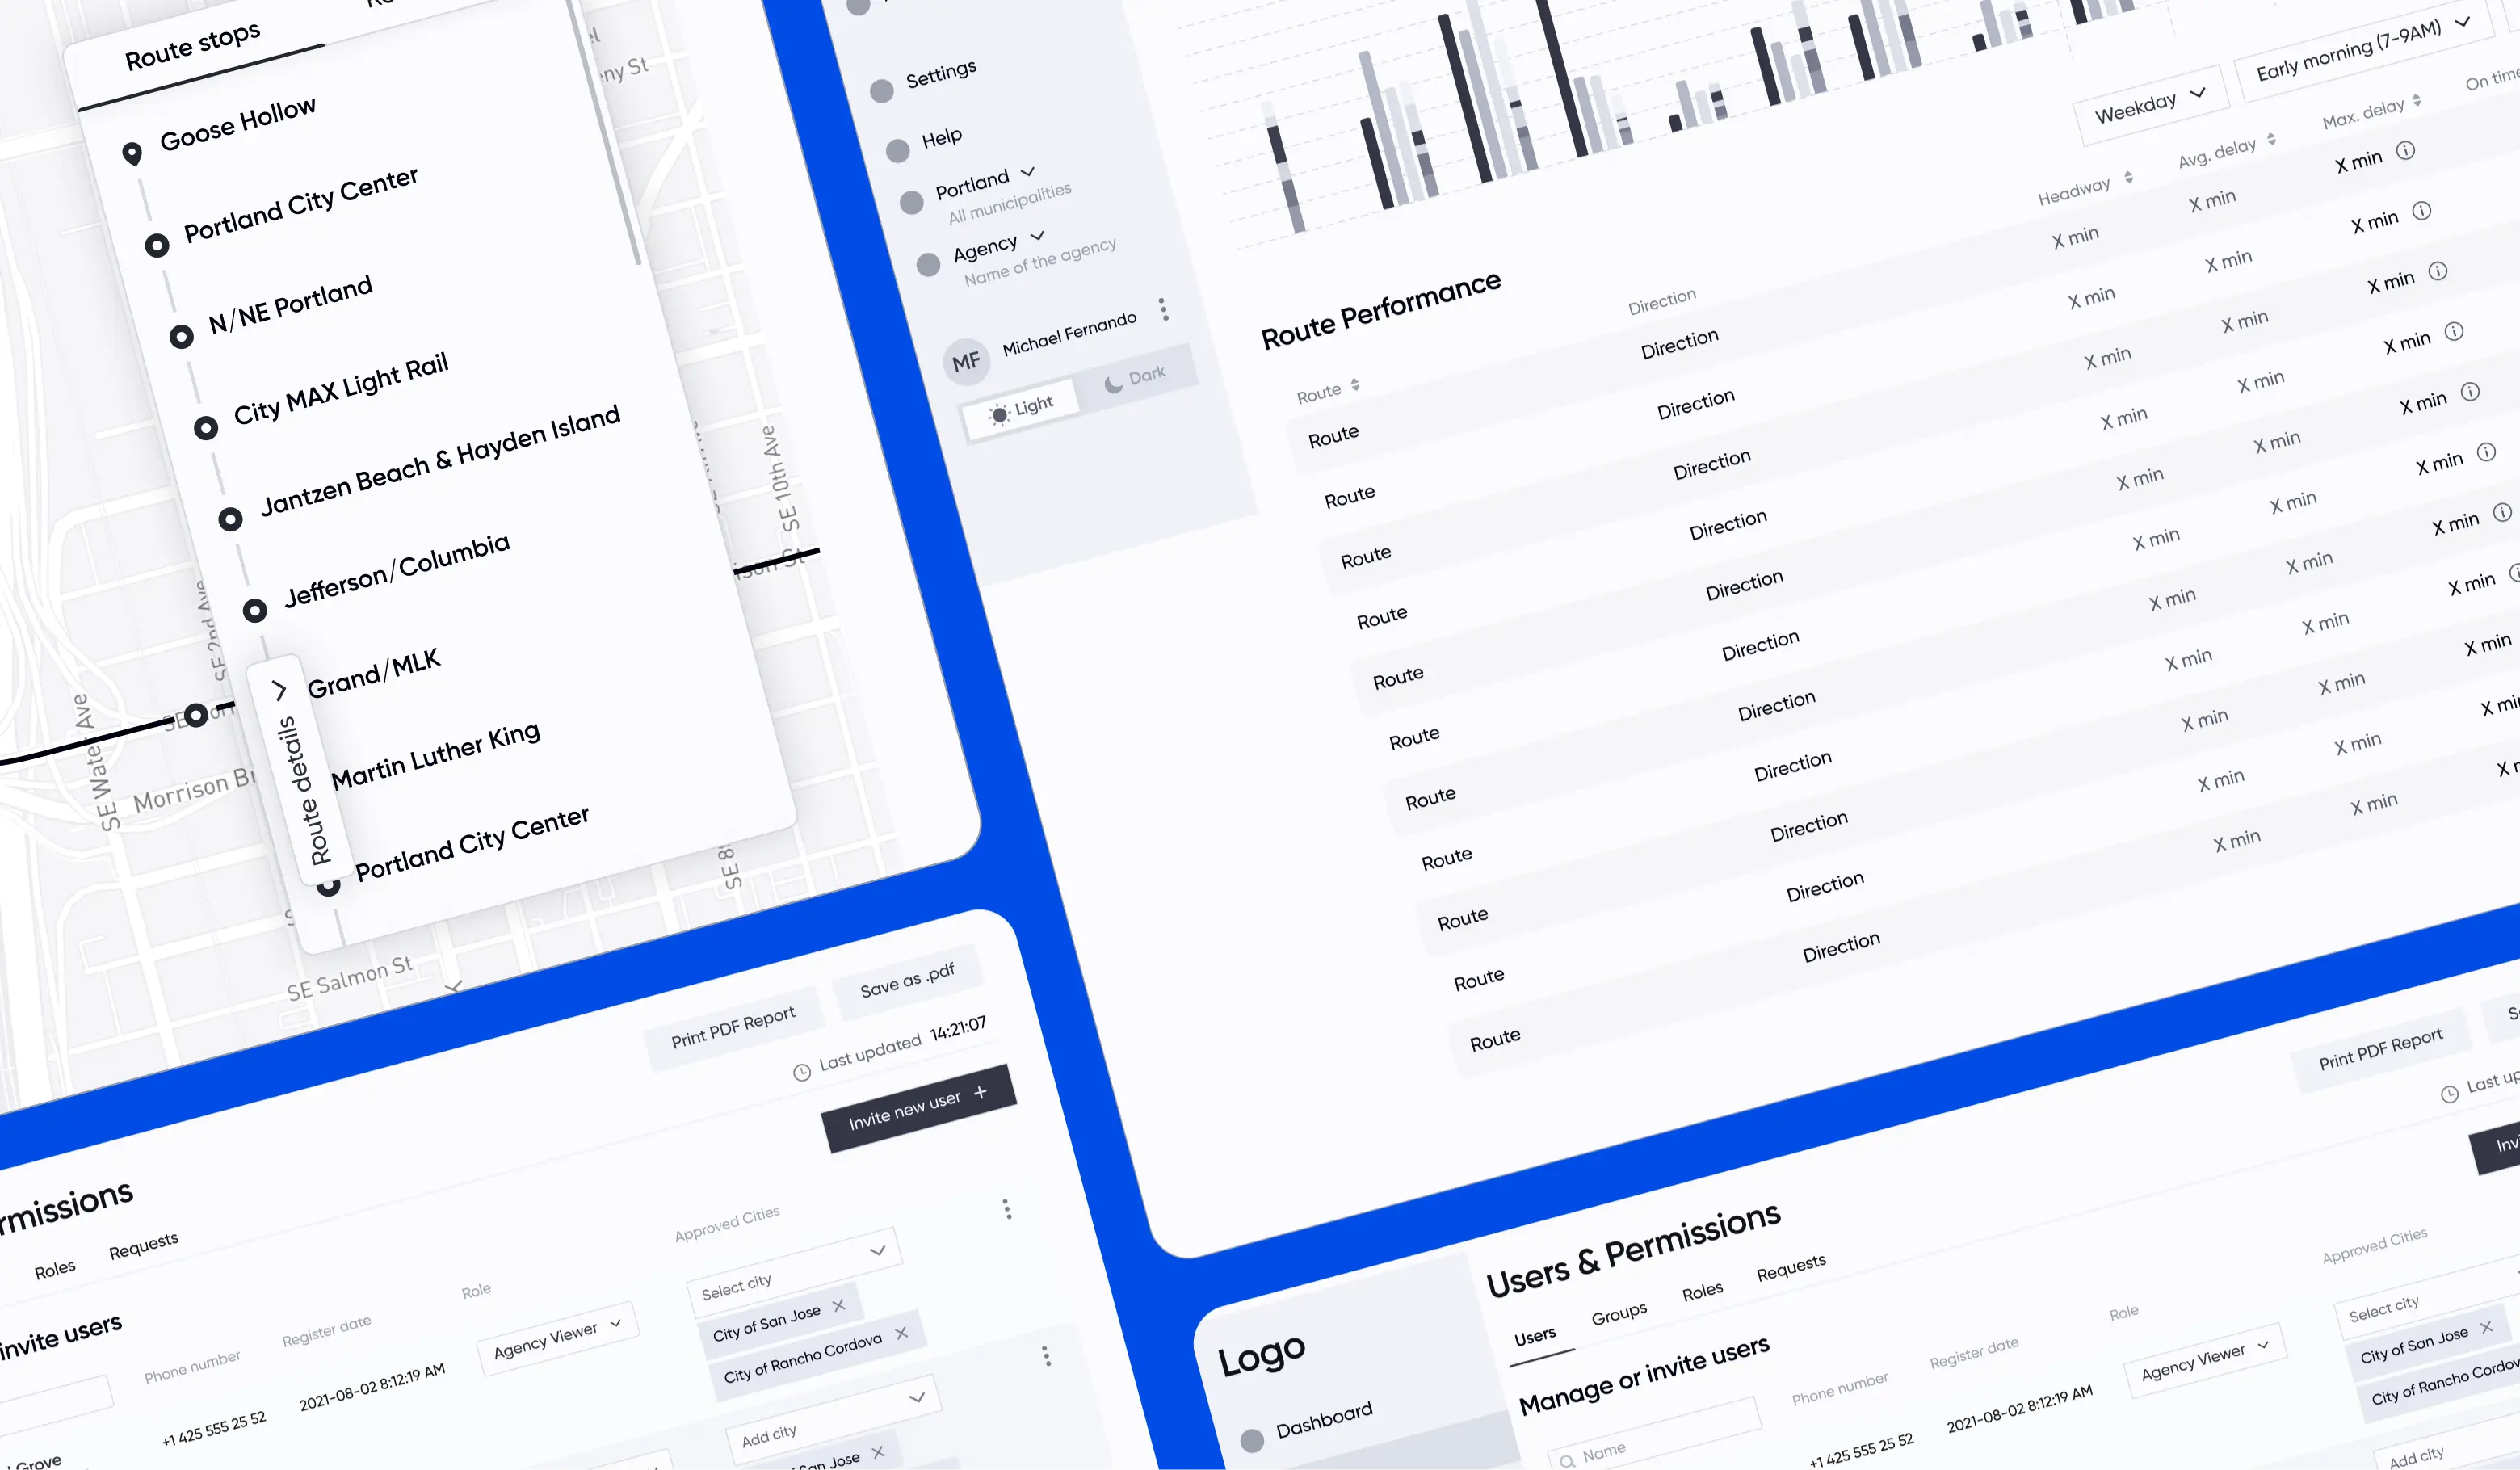
Highly Detailed Wireframes
Used wireframes, we provided a clear and simplified way to communicate the basic idea and functionality of a design, making it easier for non-technical stakeholders to understand and provide feedback. Our main goal is to receive fast feedback and move to next iterations.
Objectives
1. Easy Traffic Management with Bird’s Eye View
2. Customizable for Your Needs by development custom dashboards with ability to scale easily
3. Alerts systems
Impressive, isn't it?
Looking for a custom Web Developement App service?

Lampa IT Outsourcing team is the best option for you. Book a free consultation to explore more!
Architecture
Our architecture is designed to support high-performance real-time data handling across both the front end and back end.
Front-End
Handling large quantities of data in a front-end Preact application, especially in real-time, requires careful consideration of architecture patterns to ensure efficiency and performance. We focused on with Data Layer Separation. Encapsulated data fetching logic, socket connections, and data processing. These things kept components clean and focused on rendering.
Back-End
For handling large quantities of real-time data on the backend, we used an architecture that can efficiently manage high-throughput data streams, process them in real time, and reliably serve this data to the client. We did several things:
0) Microservices Architecture for handling analytics calculation and real time data processing
1) Event-Driven Architecture for asynchronous processing
2) Stream Processing for real-time data transformation
Databases / Third-party Services


Real Time Data Processing
We used several techniques to do it easier and not to lose performance
Debounce/Throttle Updates
Implement mechanisms to control the frequency of updates to the UI. Also implemented less frequent update for the UI sections that are not in focus right now.
Use Web Workers
Offloaded heavy data processing to Web Workers to keep the UI responsive.
Efficient State Management
Used efficient state management practices to handle large datasets and frequent updates.
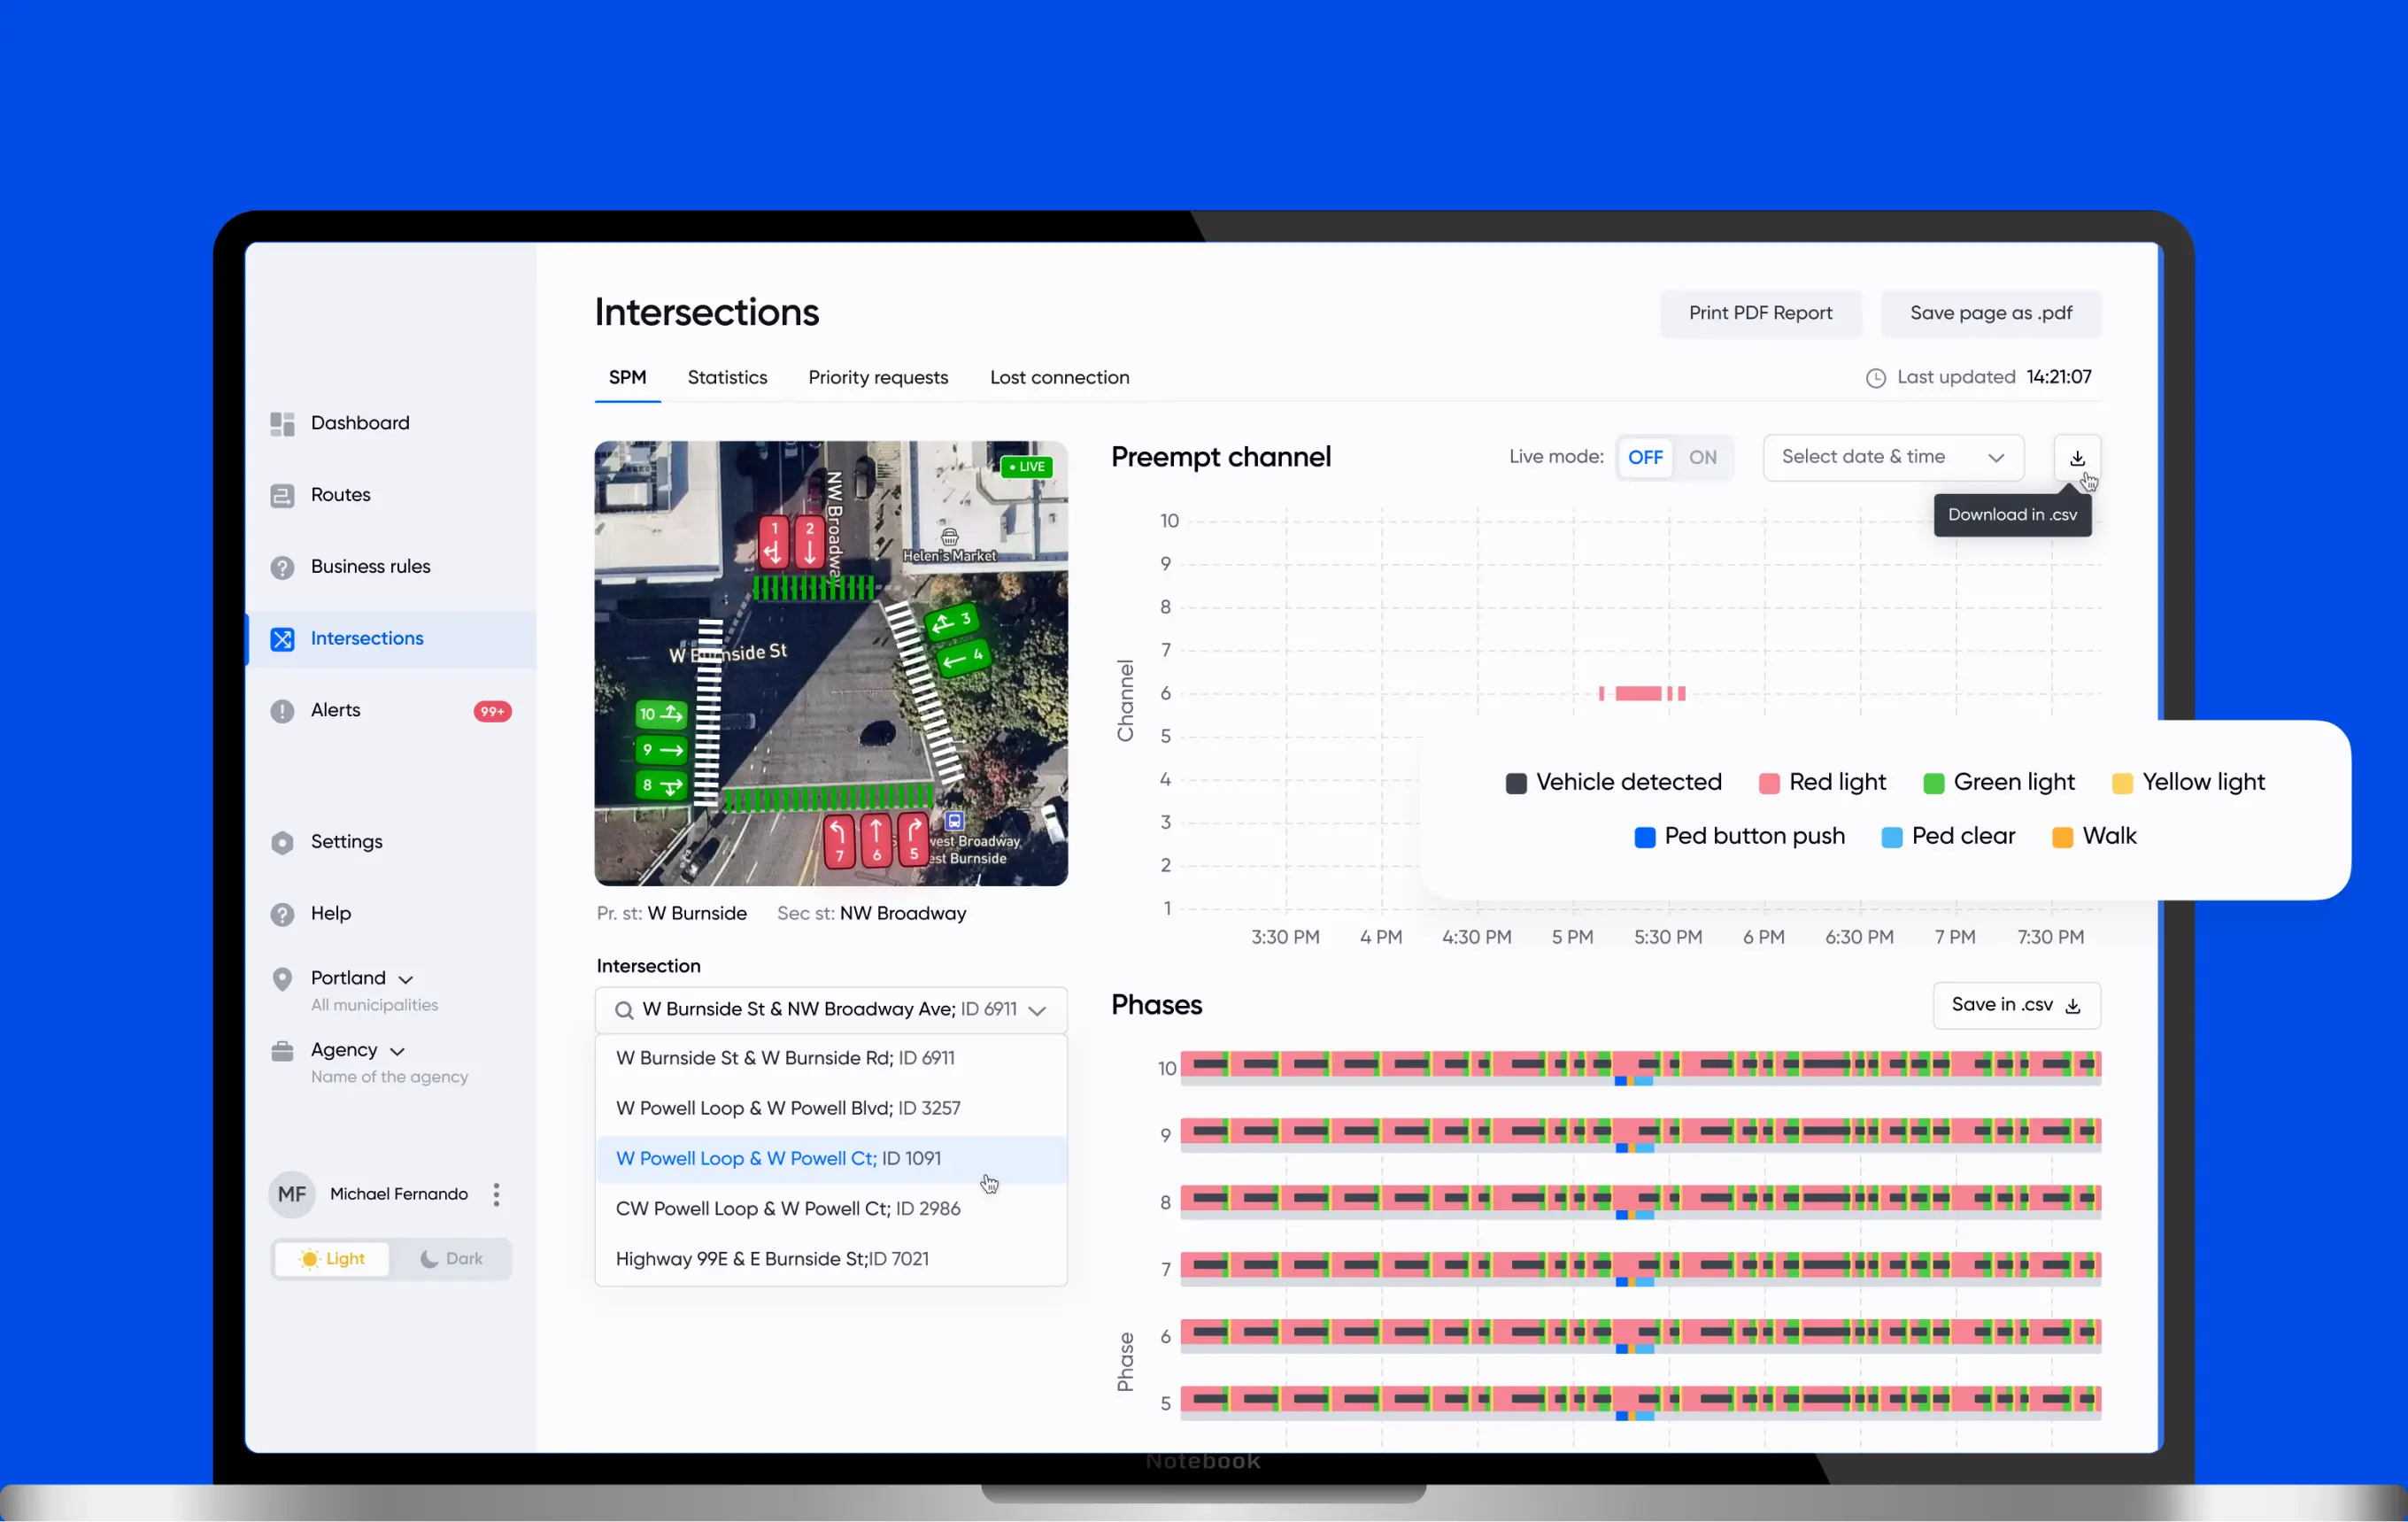
Key Technical Challenges
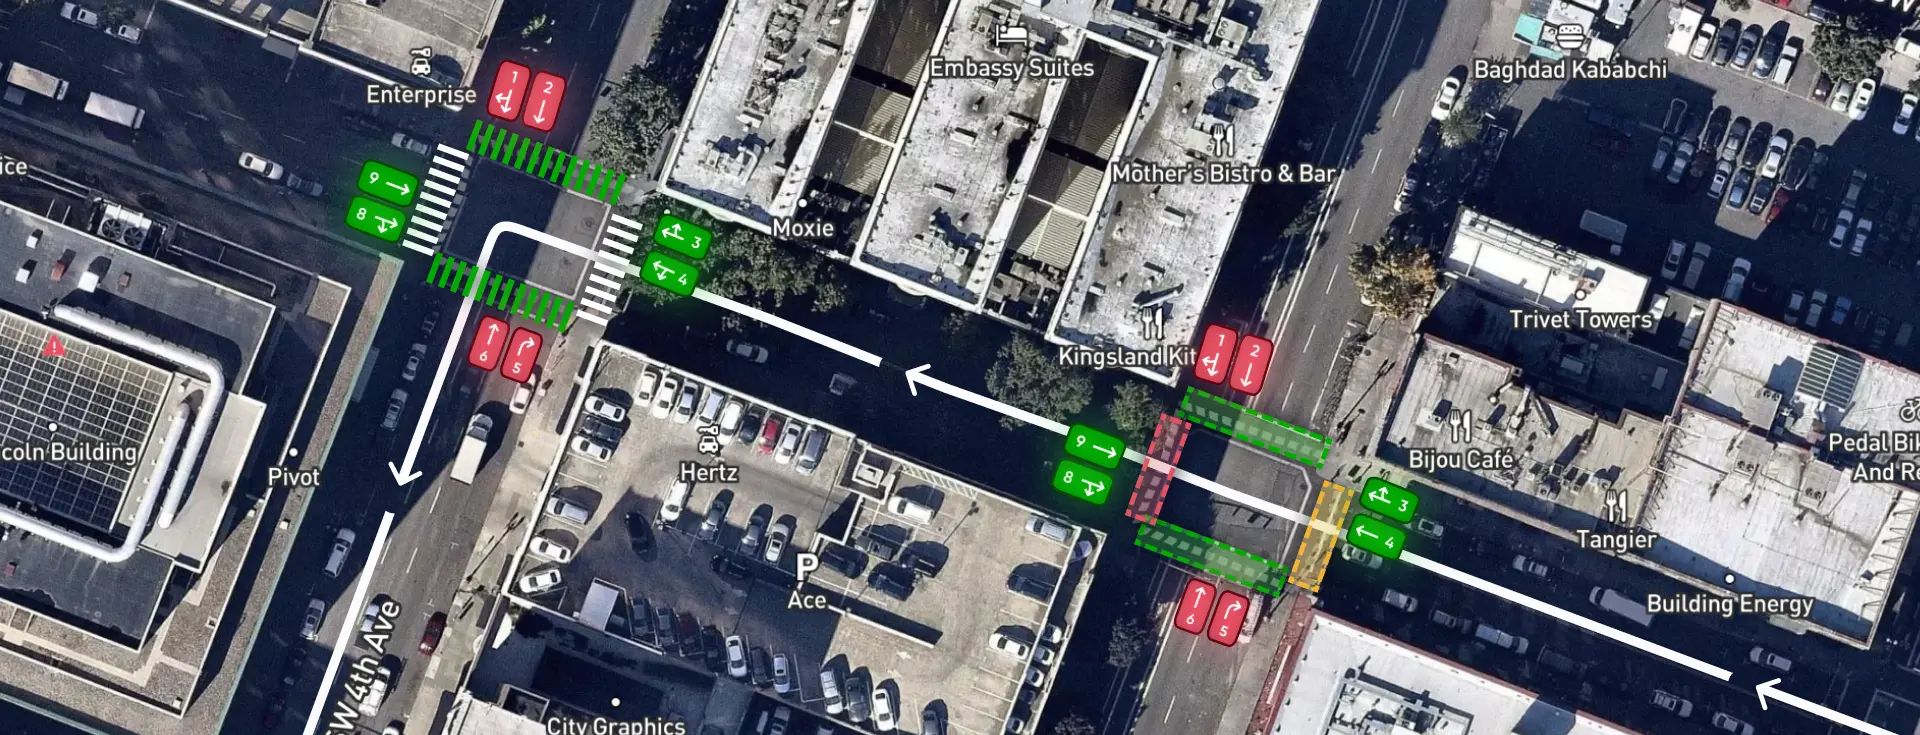
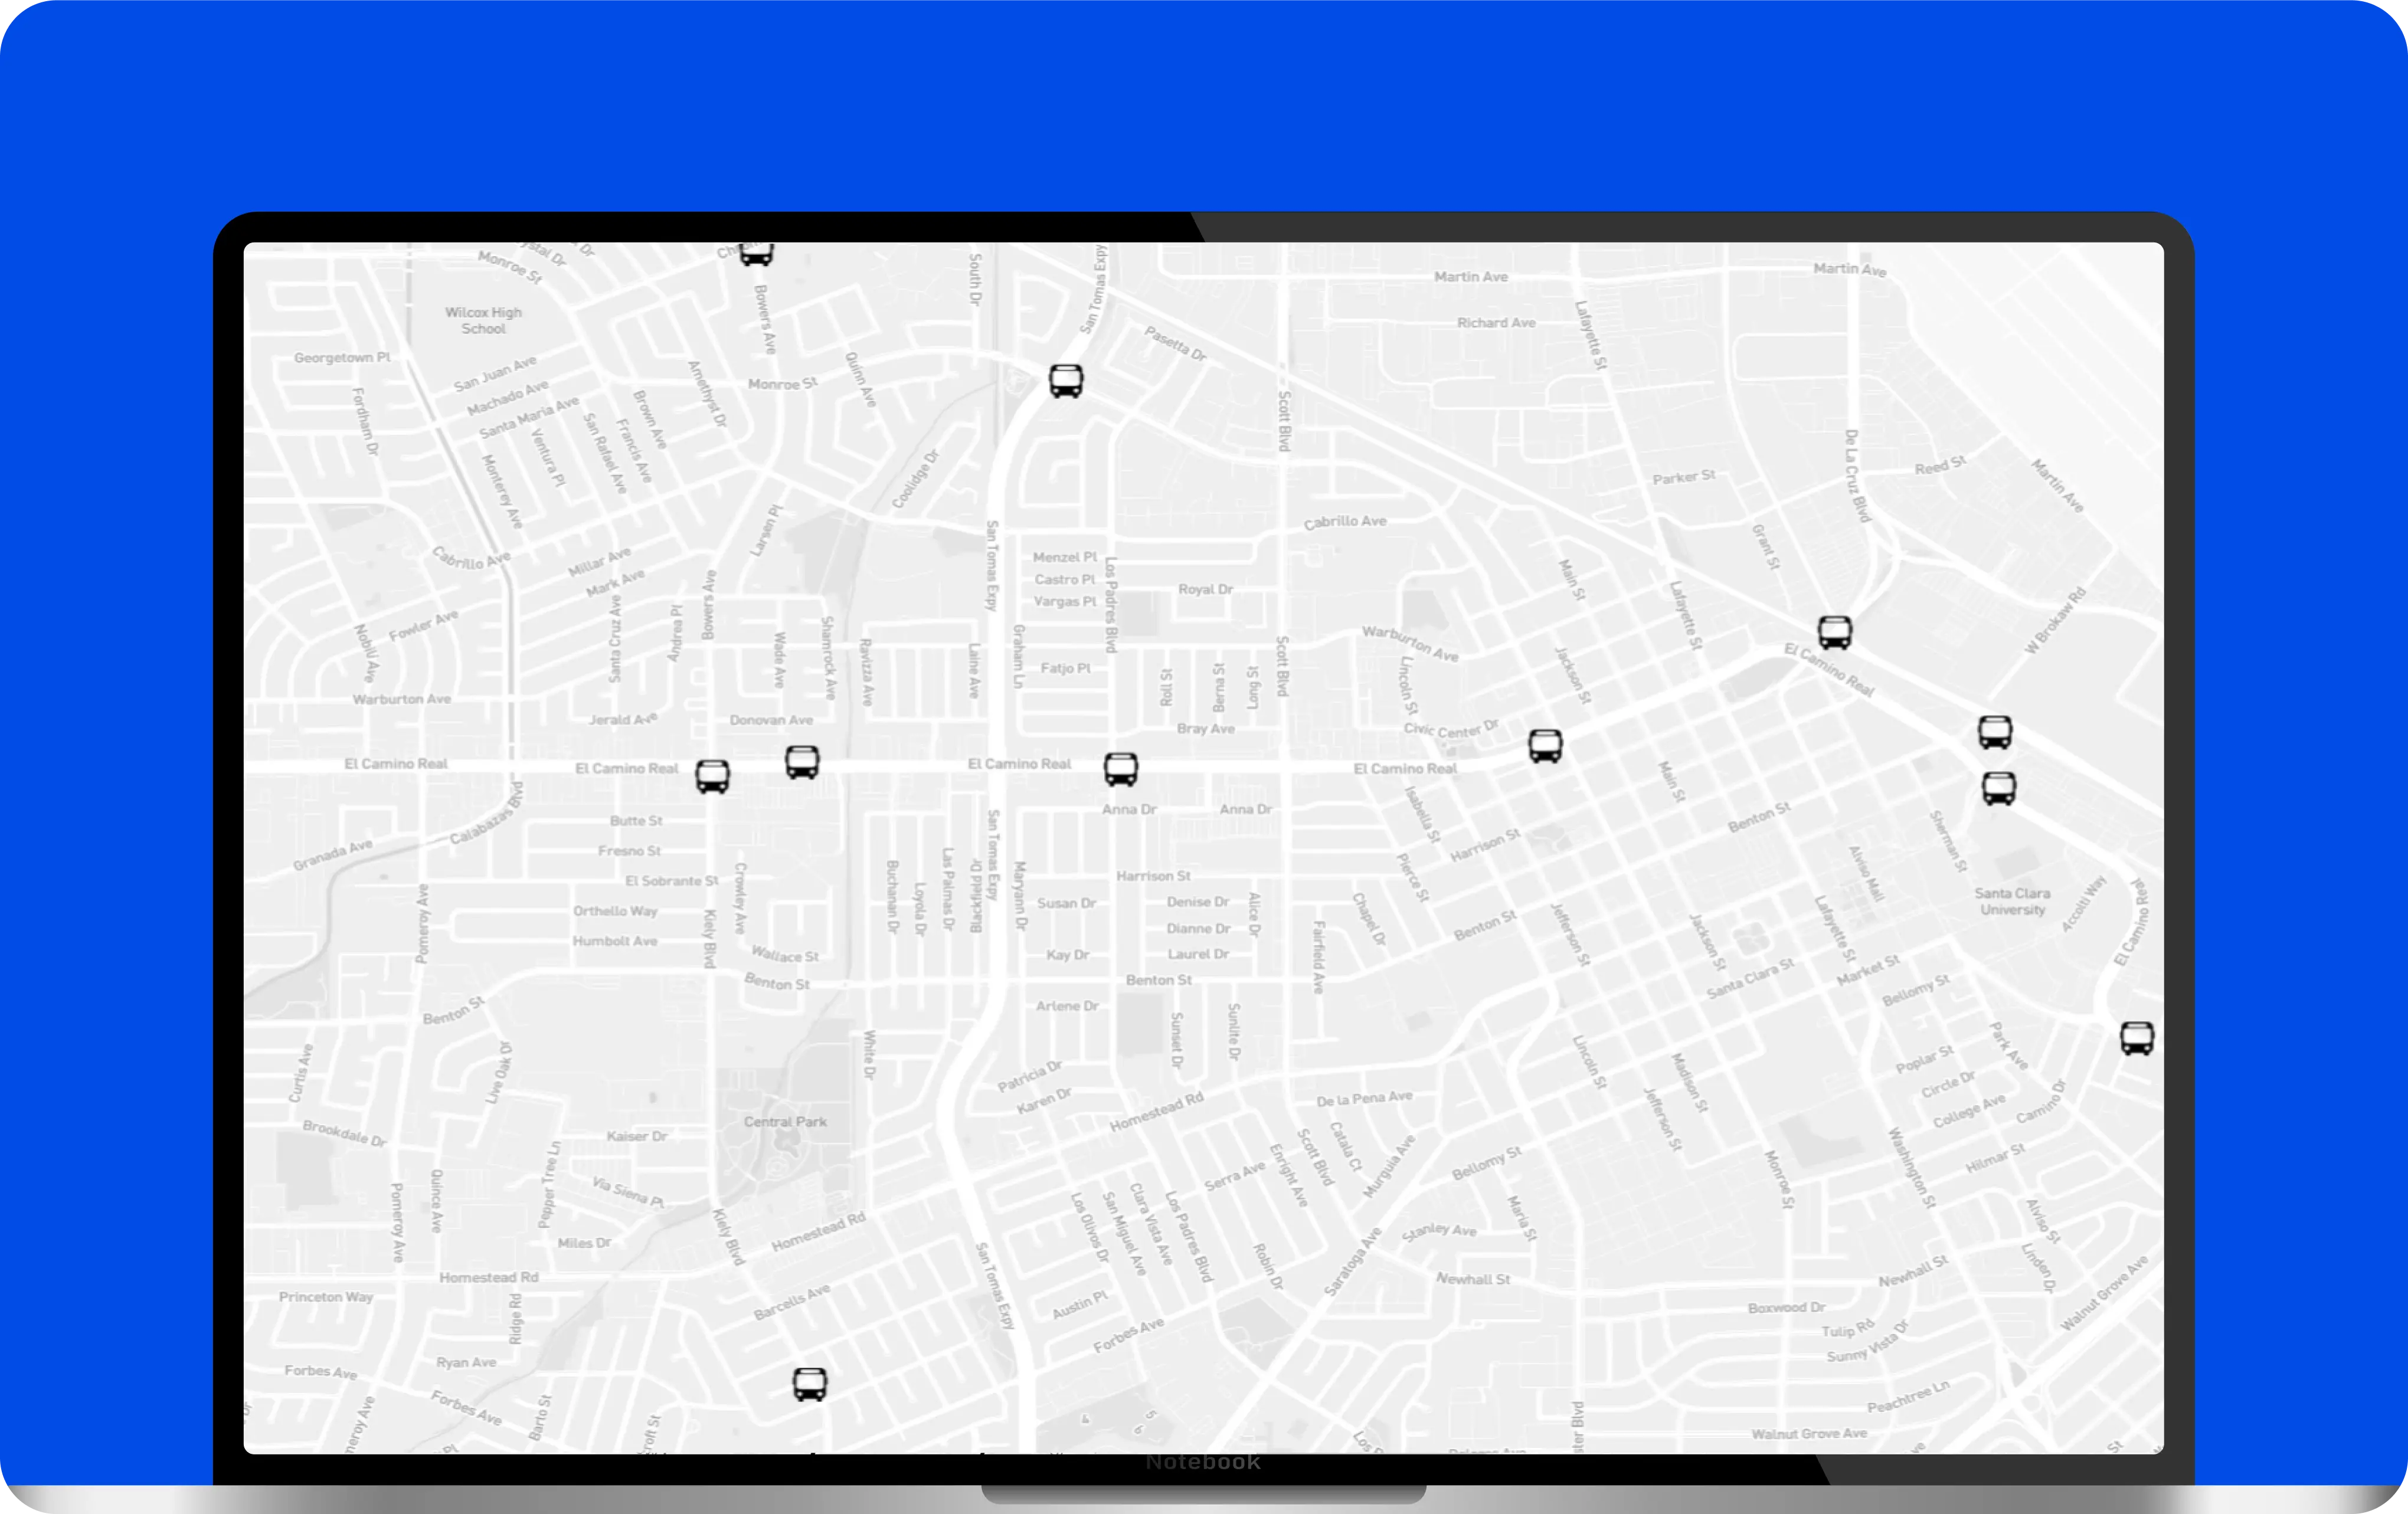
Scaling Real-Time Map Rendering for Over 100 Buses
Data collection and processing
Using a low-level approach to data rendering without abstractions
Data sources
Data from the city's sensors was transmitted to a separate data bus. Part of the data was displayed on the map immediately and also stored in a storage for analytics.
Data processing approach
We received all the data for the map in real time from the data bus. For static data, we used a separate microservice for storage and analytics computing.
Libraries that we used
Efficient rendering
Web Workers
In-Memory Data Structures
Data Throttling/Debouncing
Libraries that we used for visualization
OpenGL rendering solutions
Chart.js
Socket.IO
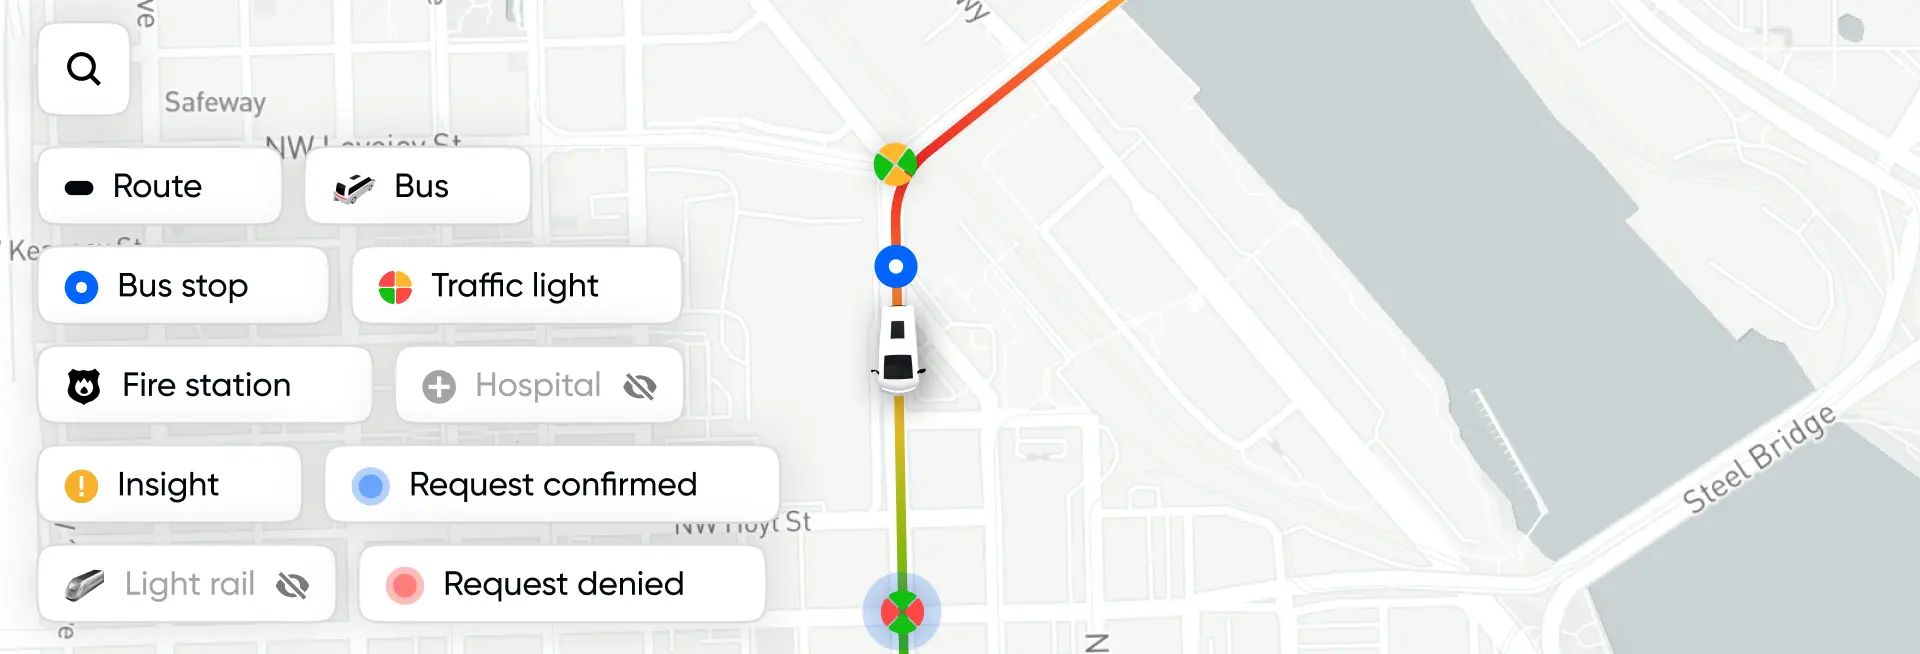
Real-Time Traffic Insights
Stay Updated with Continuous Monitoring of Bus Movements and Intersection Status. Watch Our Detailed Video Demonstration of Real-Time Traffic Patterns. Experience Enhanced Navigation and Efficient Transit Management Through Visual Insights. Observe Live Traffic Flow and Make Informed Decisions with Ease.
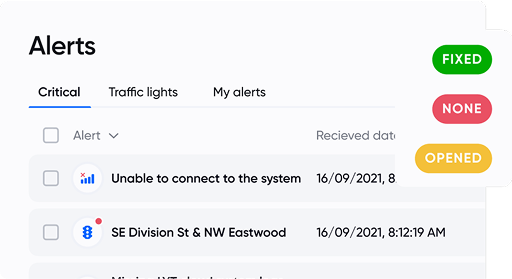
Notification System
We created a multi-level customized alert system so that system users could respond to problems in a timely and fast manner
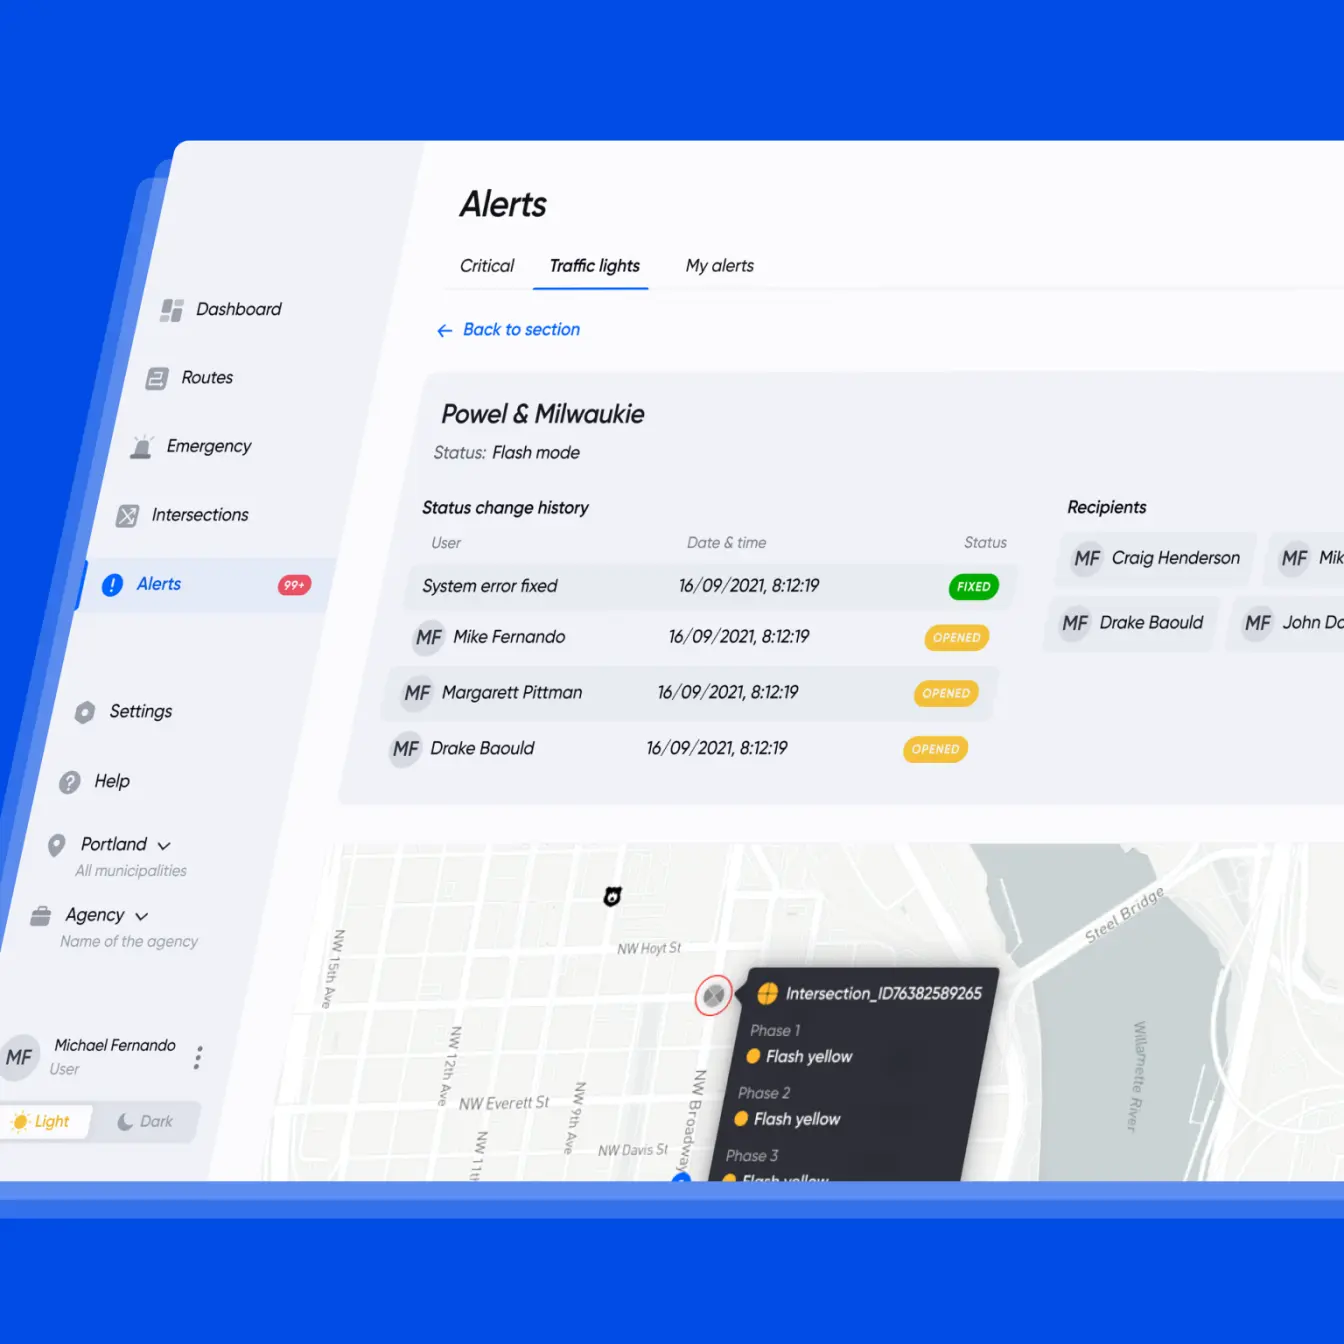
The notification system was based on the example of a ticketing systems. There were notifications that were assigned to people who were responsible for solving them and could contact the necessary departments from the city administration
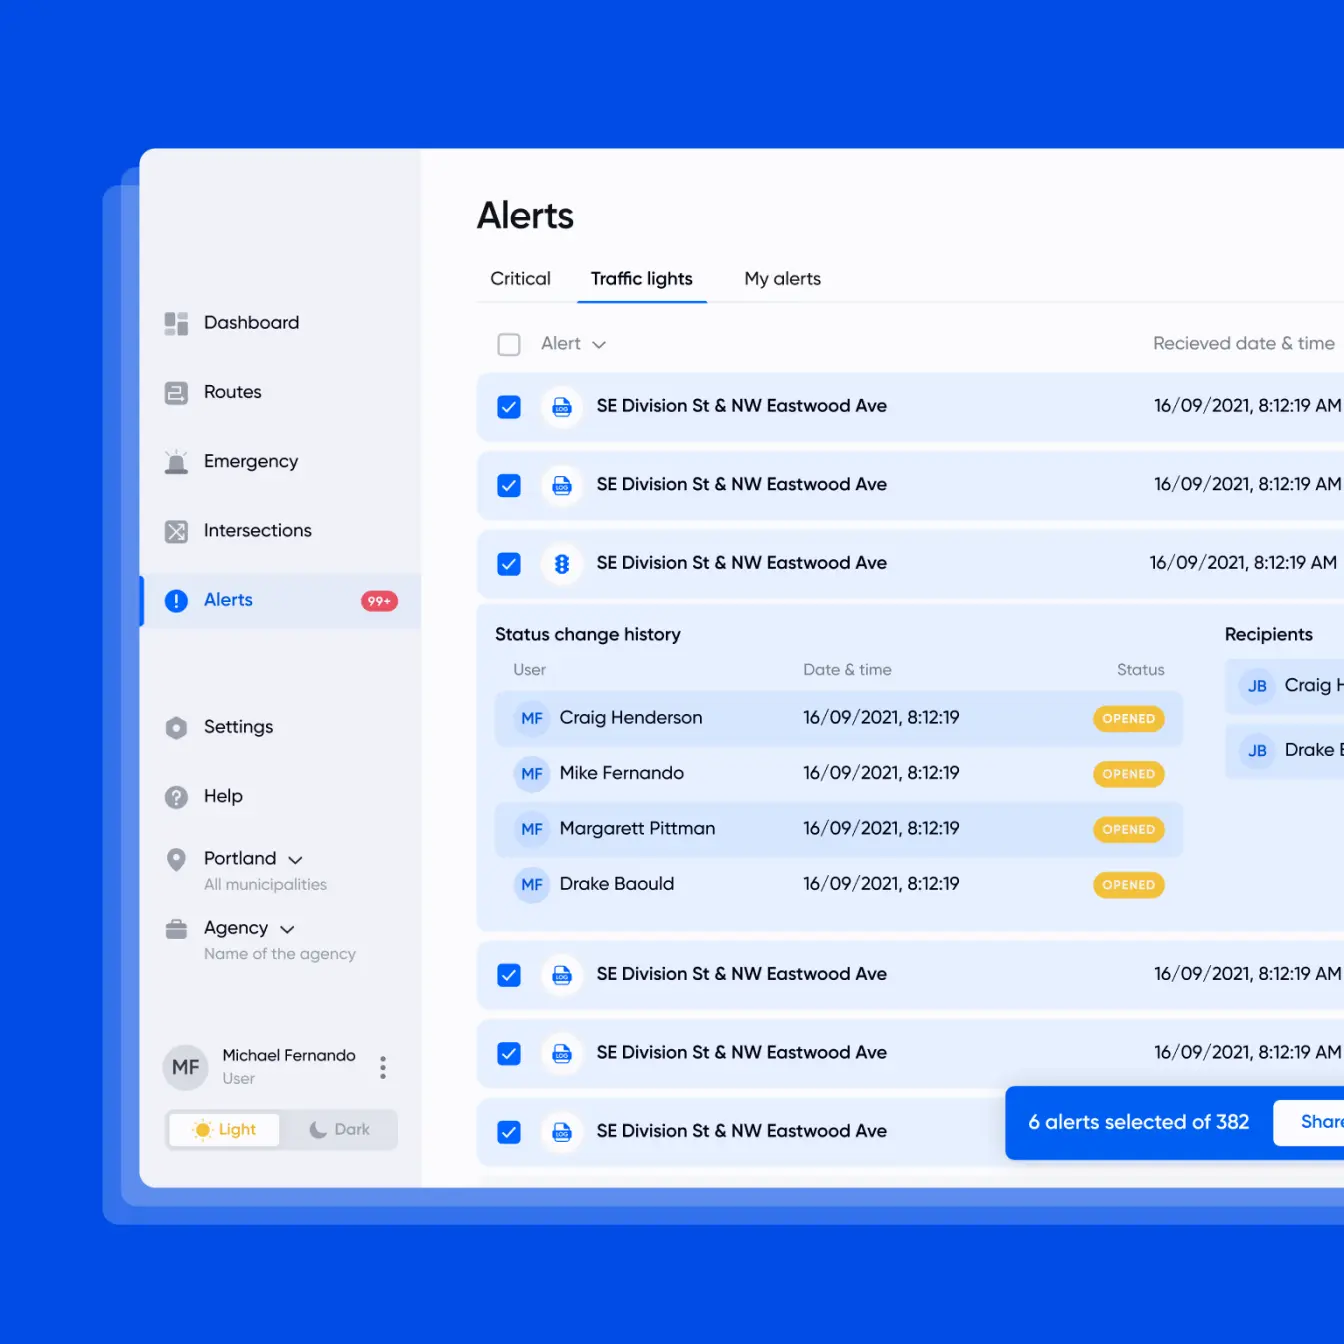
Each company could customize certain types of notifications, notification delivery methods, cohorts of people who should receive them, and backup delivery routes. Thanks to this, we were able to reduce staff response times.
Lessons Learned
Our cloud-based platform enabled scalable deployment across cities, while operator feedback showed faster issue detection. Optimizing map rendering and using edge computing improved processing efficiency, supporting accurate scheduling and system scalability.
Scalability and Flexibility
The cloud-based platform allowed for seamless scalability for different cities.
Operators satisfaction
Feedback from transit operators indicated a notable improvement in their experience. They were 30% faster to detect issues with signals and anomalies
Our knowledge
To improve the performance, we had to update my knowledge of low-level map rendering.
We optimized the cloud-based infrastructure to enhance processing power and storage capacity. By leveraging edge computing, we reduced latency and ensured that real-time data processing was efficient, supporting the system's scalability from hundreds to thousands intersections.
+34%
Enhanced Bus Scheduling Accuracy
Interested
in our services?
Fill out the form, or contact us at:
Let's work together